Diagrams, and particularly ‘infographics’ feel like an inherently modern phenomenon. Something that only people whose time is no longer consumed with avoiding plagues, scurvy and constant warring have the luxury of creating. But as 100 Diagrams That Changed the World: From the Earliest Cave Paintings to the Innovation of the iPod shows, there are some truly beautiful examples from medieval times and even earlier of man’s urge to bring order to the world around him through these highly technical yet aesthetically gorgeous works. Here’s a selection for your viewing, Pinning and printing pleasure:
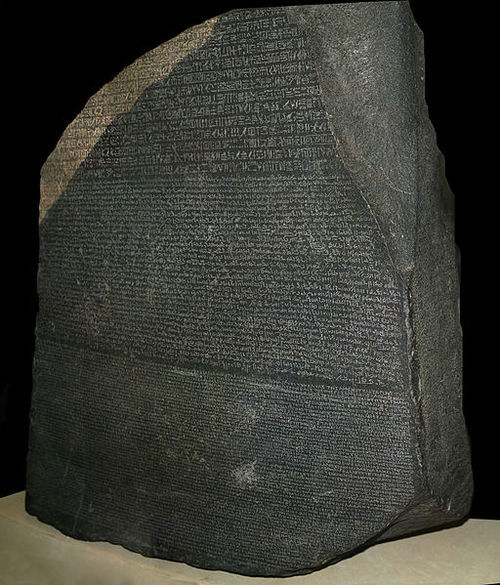
The Rosetta Stone – 196 BC
Allowed Egyptologists to decrypt hieroglyphics for the first time, due to the same message written here in three different languages (hieroglyphics, Demotic, Greek).
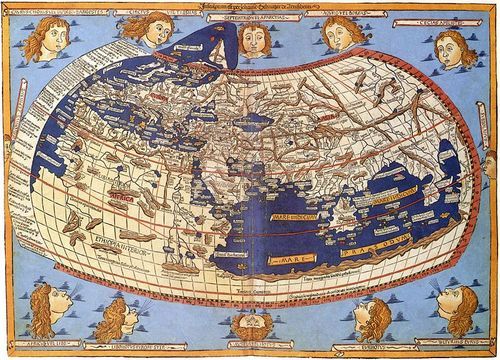
Ptolemy’s World Map – Claudius Ptolemy, c. AD 150
Created around 700 years after the ancient Greeks realised the Earth is spherical, this map is an impressive world atlas, though note the disproportionately large Old World, and the errors in the extreme southern hemisphere.
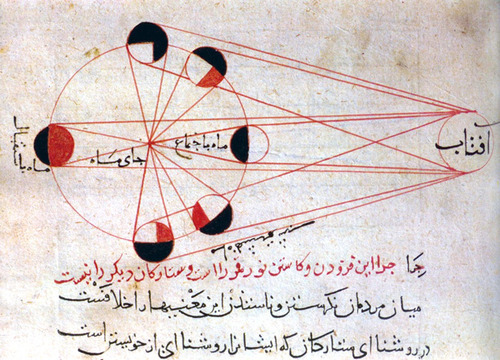
Lunar Eclipse – Abu Rayhan al-Biruni, 1019
Diagram showing the phases of the moon, from al-Biruni’s Kitab al-Tafhim
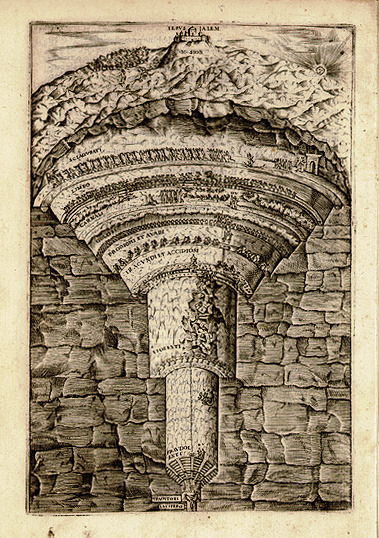
Dante’s Divine Comedy – Dante Alighieri, 1308-21
19th century interpretation of Dante’s map of Hell.
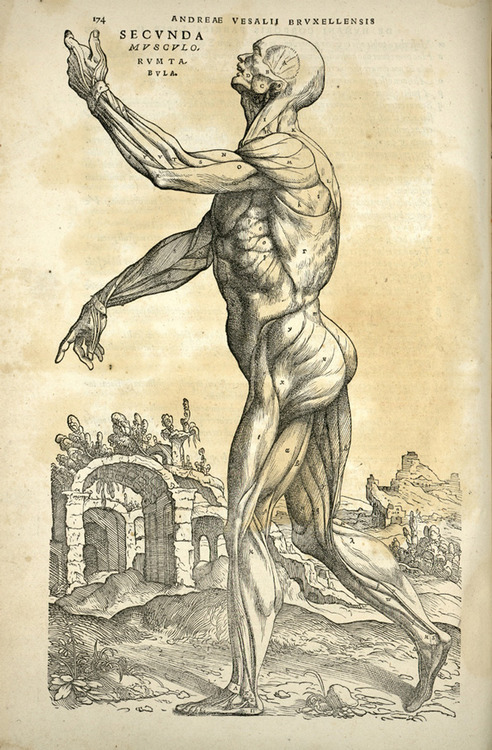
Human Body – Andreas Vesalius, 1543
No-one had seen anatomical illustrations quite like De Humani Corporis Fabrica. Detailed and animated, these drawings have become some of the most important in medicine.
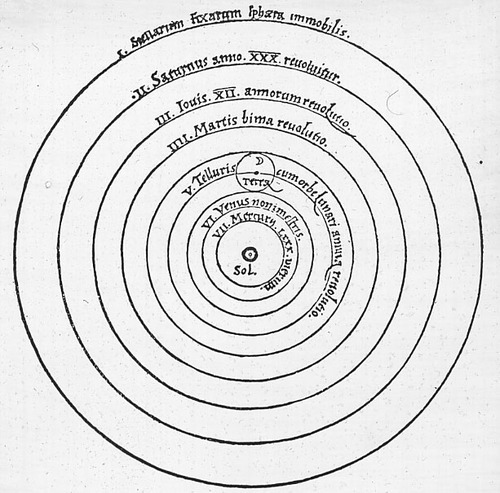
Heliocentric Universe – Nicolaus Copernicus, 1543
Copernicus risked accusations of heresy when he published this revolutionary plan of the universe showing the sun, not the Earth, at the centre.
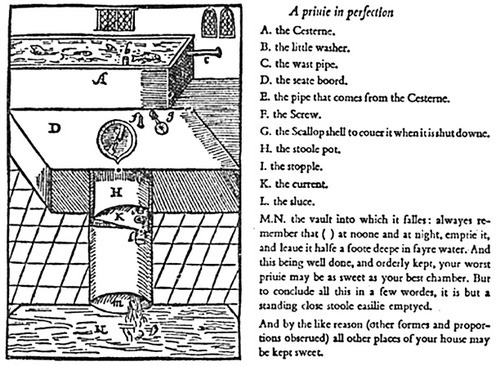
Flush Toilet – John Harington, 1596
There is the world pre-flushing toilet, and the world post-flushing toilet. This single invention improved living conditions in towns and cities immeasurably, allowing people to dispose neatly of their waste rather than literally throwing it out of the window into street-level cesspits.
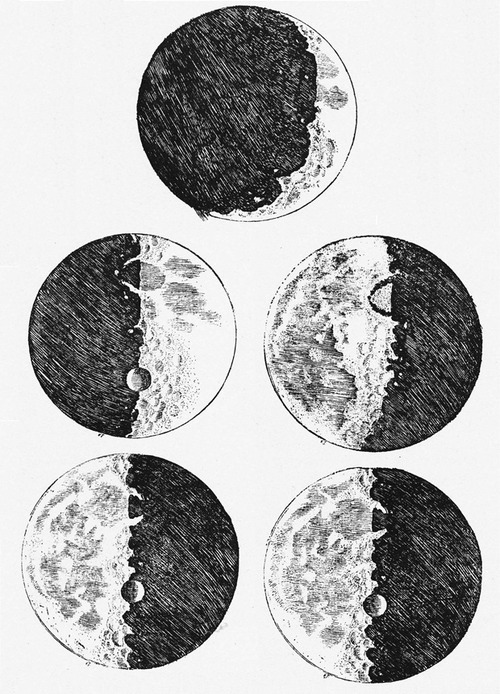
Moon Drawings – Galileo Galilei, 1610
Until Galileo drew these detailed drawings of the moon – aided by his telescope – showing mountains and valleys, people thought the surface of the moon was smooth.
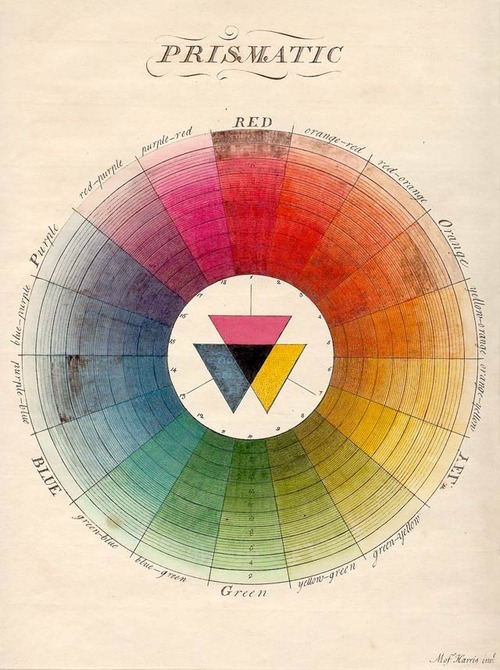
Color Wheel – Moses Harris, 1766
The first full colour wheel of its kind is a thing of real beauty.
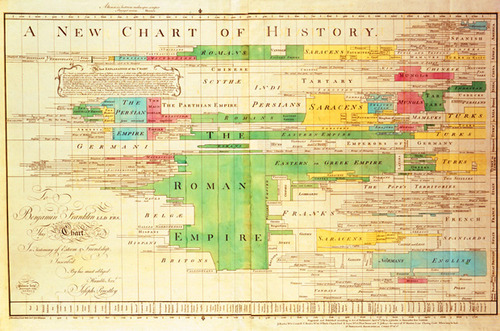
A New Chart of History – Joseph Priestley, 1769
Of all these examples, this most closely resembles a 21st century infographic, taking a large unwieldy data set and visualising it as a timeline.

Line Graph – William Playfair, 1786
This 18th century graph was the first use of a line graph to display economical data.
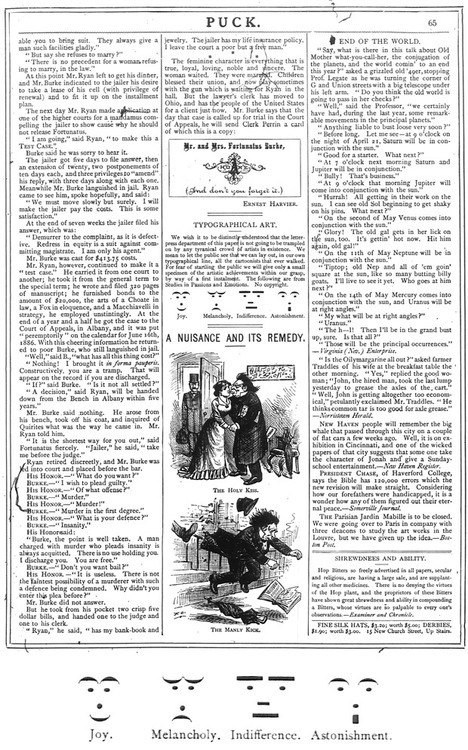
Emoticons – Puck Magazine, 1881
This feature of ‘typographical art’ brings us the first known use of what could be called emoticons 😛
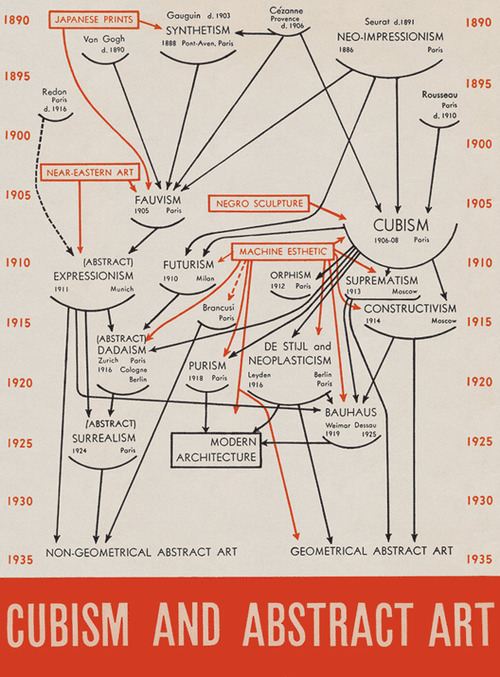
Cubism and Abstract Art – Alfred Barr, 1936
This unusual diagram shows the pivotal role Cubism played in the development of Modern Art.
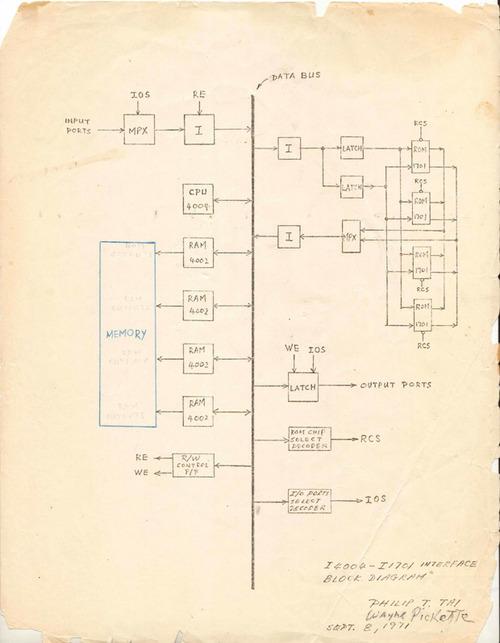
Intel 4004 CPU – Ted Hoff, Stanley Mazor, Masatoshi Shima, Federico Faggin, Philip Tai, and Wayne Pickette, 1971
Intel’s early demonstration board, which would later prove to be the grandaddy of all modern home computers.
Want to learn new creative and marketing skills with me? Check out upcoming courses on topics like SEO, content marketing, copywriting and podcasting.
What's trending in digital marketing?
Stay on top of the latest news, tips, tools and updates in digital. Just for people in marketing and business. No fluff, no ads, no spam.
Join thousands of readers keeping abreast with it all, every Thursday.


